A Mock Case of Neonatal Meningitis
Attention Conservation Notice: 1138 words using stiflingly simple computations to go through an example of finding the cause of made-up case of a medical condition that is unlikely to ever affect you personally. Also, I am not a doctor.
Imagine that a one and a half week year old girl comes in to the hospital with a four day illness consisting of cyanosis, pain unresponsiveness, neck tenderness, and temperature instability. You perform a lumbar puncture and the CSF has elevated neutrophils and decreased glucose, suggestive of bacterial invasion. Which organism is most likely to be causing the infection?
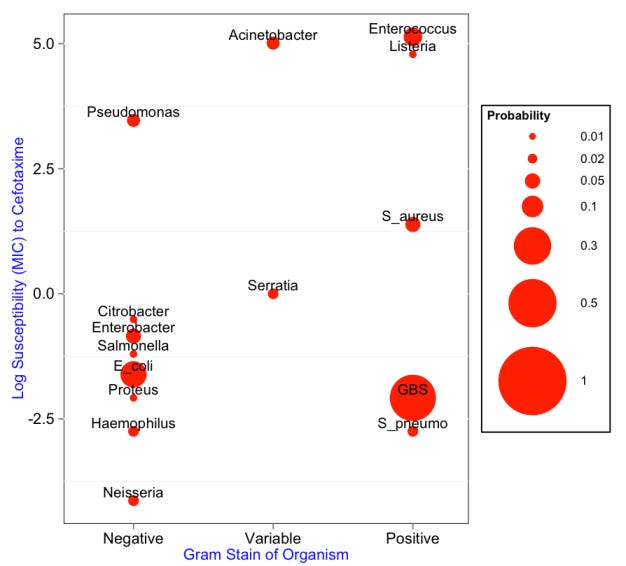
In order to calculate prior probabilities, let's use this data set of empirical frequencies from recent years. The most likely cause is Group B Strep (GBS; p = 0.46), followed by E. coli (p = 0.15).
Below, the prior probabilities that each organism in the data set will cause the infection are shown in a bubble chart using ggplot2. The probability is proportional to the area (not the radius) of the circle. The x axis denotes the typical gram stain of that organism; Acinetobacter and Serratia are considered gram variable.
The textbook empirical regimen for neonatal meningitis is cefotaxime and ampicillin. Most of the possible bacterial causes of neonatal meningitis are susceptible to cefotaxime, while ampicillin is used to treat Listeria and Enterococus.
It is desirable to reduce the antibiotic spectrum as much as possible, so as soon as you know that the agent causing your infection is susceptible to one of the two antibiotics, the administration of the other is typically stopped.
The y-axis, therefore, denotes the resistance of each of the bacteria to cefotaxime, calculated using this pdf data set. Note that Acientobacter, Enterococcus, and Listeria are actually "off the charts" insofar as they don't even have their susceptibility determined as a MIC. Their values are set to an artibrarily high value for visualization purposes.
Gram Stain Test
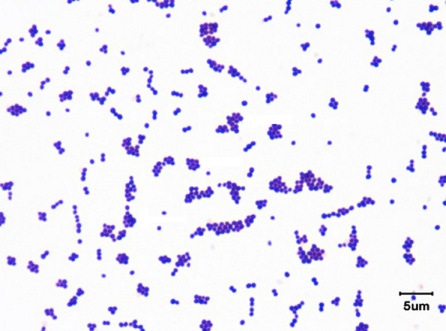
In order to narrow down the possibilities, we will first perform a gram stain of the CSF. Imagine that this is the result (modified from here):
In addition to the color indicating gram positive bacteria, this is informative because it allows us to evaluate the morphology of the bacteria. Among the gram positive organisms, S. pneumo, GBS, S. aureus, and Enterococcus are all cocci, while Listeria is a rod. Among the gram variable organisms, Acinetobacter are coccobaccili and Serratia are rods.
Theoretically, we could distinguish between S. pneumo, GBS, S. aureus, and Enteroccocus on the basis of how the cocci are distributed within the slide (i.e., in pairs, chains, or clusters), but that type of information is slightly more challenging to put into quantitative form given our currently available data and technology, and it won't be as informative.
Gram stain sensitivities and specificities (e.g., for S. pneumo) are each about 97.5%, which corresponds to a likelihood ratio of 39 for each of the positive cases and a likelihood ratio of 0.026 for the negative cases.
So, multiplying the likelihood that each bug is causing the infectious by its prior probability gives us the posterior probability; these are plotted for each agent below, and probabilities less than 0.01 are not shown.
In terms of case management, the probability of Listeria has dropped significantly, but we must still keep our hypothetical patient on ampicillin because of the possibility of Enterococcal infection, which is consistent with the gram stain and has therefore increased in probability.
Hemolysis Test
The next test that we perform is to streak the bacteria on sheep blood agar and see whether they demonstrate beta hemolysis. Imagine that this is the result:
Although it is slightly weak, the region in the middle of the plate from which bacteria has been removed demonstrates beta-hemolysis. About 33% of Enterococci, 99%+ of S. aureus, 99%+ of GBS, and 1% or less of S. pneumo would show beta-hemolysis. (S. pneumo classically shows alpha hemolysis.)
We can convert these proportions into likelihoods, use the posterior probability of the last test as the prior for this test, and multiply the prior times the likelihood to get the new posterior. The results are below:
Although Enterococcus is now less likely to be the bug because a smaller proportion of its typical clinical isolates show beta-hemolysis, it is still very possible, and the patient should remain on the course of ampicillin.
Lancefield Test
At this point, we pull out one of our big diagnostic guns to really narrow down the possibilities: the Lancefield antigen test. Specifically, we'll use the BBL Streptocard Acid Latex Test (pdf). Here is the result of that test, with Lancefield antigens A, B, and C in the first three positions of the upper row from left to right:
The test has a sensitivity of 98% and a specificity of 99% (well they claim 100%, but it's a small sample size), which yields the high likelihood ratio of 98.
As a result of the positive result on this test and none of the other antigens, Group B Strep is much more likely to be the cause of meningitis in this patient; this is reflected in its dominance of the probability mass below.
At this point, you could probably take the patient off of ampicillin, since GBS is susceptible to cefotaxime.
Limitations:
In reality, most of the error in each of the tests is likely due to contamination, and since this same contamination might affect all three of the tests in the same way, it is somewhat foolhardy to assume that the tests are independent, as we have. However, a) this type of correlation data between tests is very difficult if not impossible to find, and b) the positive result on the Lancefield antigen test in particular is unlikely to be confounded by contamination. Ways to mitigate this this are to a) take multiple samples of CSF and b) be scrupulous in laboratory procedures.
The probability of a false negative is considered uniform for all alternative possibilities. In reality, some bugs are probably much more likely to falsely appear to have a different set of properties on a particular test. If there are any bugs that are "great imitators" on a few such tests, then small differences in probability would begin to aggregate, and this method might miss one of those bugs really badly.
Notes:
Raw data and computations can be found in this Google Spreadsheet.
R code for making the bubble plots is on GitHub.
Thanks to Mike Chary and Joe Lerman for help on this. All mistakes are mine.


